OmegaOS
Operations

Company Operating Map Interface

Company Operating Map Interface explains how buyers and operators learning how OmegaOS product-line operating systems work together can connect Forge, Hermes, Aureus, Mnemosyne, Vortex, Agora, and Vita to company outcomes while preserving the OmegaOS evidence and authority boundary.

hermes-growthpillar:pillar-09-product-line-os-educationcluster:cluster:pillar-09-product-line-os-education:04operating-mapstudiocompany-graph
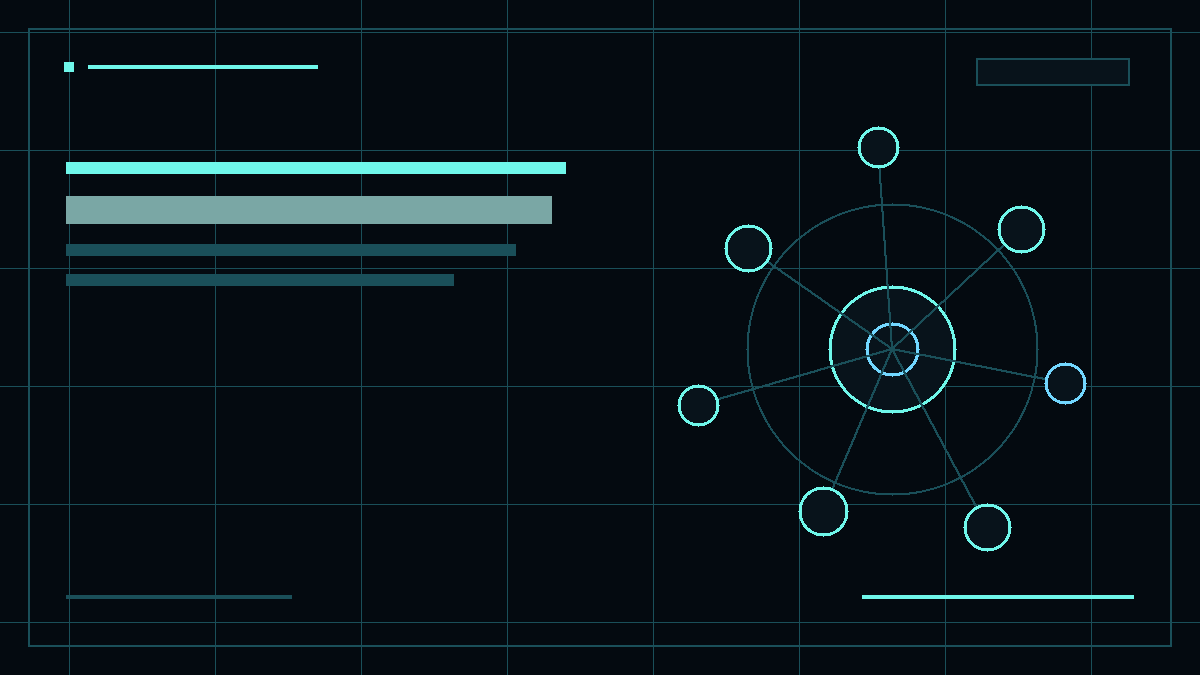
OmegaOS editorial illustration for Company Operating Map Interface. Company Operating Map Interface public OmegaOS visual showing the main buyer outcome.
OmegaOS editorial illustration for Company Operating Map Interface. Company Operating Map Interface public OmegaOS visual showing the main buyer outcome. Source: Omega Neural Technologies. Rights: Omega Neural Technologies original editorial asset.

Executive summary

Answer What is Company Operating Map Interface? for founder, technology leader, functional executive and connect the answer to the Product-Line OS Education pillar, evidence, and next conversion path.

  • Product-Line OS Education buyer decision checklist
  • current product availability must be verified for the intended configuration
  • outcomes depend on scope, source quality, authority, and reviewed evidence
  • Operations public guide
Section 1

A company operating map shows how work is connected

A company operating map interface is an interactive model of outcomes, functions, teams, workflows, systems, decisions, and evidence relationships. It helps people navigate responsibility and dependency without claiming to be a perfect digital twin.

What the map represents

The map represents the operating relationships that matter for a defined purpose. A company outcome may connect to a product line, program, team, recurring workflow, responsible role, source system, and evidence record. Edges can describe ownership, dependency, input, approval, execution, or observation. Those relationships let a user ask not only where an item lives, but why it exists and what may be affected when it changes.

The map should be selective. A complete representation of every person, document, event, and application would become expensive to maintain and difficult to understand. The team should model relationships that support real decisions, then disclose coverage and freshness. A missing edge is not proof that no relationship exists. The interface is an operating view over governed records, not an omniscient picture of the company.

How it differs from an org chart

An org chart describes reporting structure at a point in time. An operating map can include that structure, but its center is the flow of responsibility and value. A product launch may cross product, engineering, finance, marketing, sales, support, security, and governance without changing reporting lines. The map shows those operating dependencies and the decisions that connect them.

It also differs from a generic knowledge graph. A knowledge graph may encode many semantic relationships without defining who can act or which state is current. An operating map needs ownership, authority, lifecycle, and evidence. The graph can help find context, but the interface should not infer that a path between two nodes grants permission, establishes causation, or makes one record authoritative over another.

Section 2

Model responsibility before visualization

The map becomes useful when its node and edge types reflect the company's operating model rather than the convenience of available data.

Define a small operating ontology

Begin with a limited set of node types such as objective, product line, program, team, role, workflow, decision, system, source, and outcome signal. Define edge meanings explicitly: owns, contributes to, depends on, approves, executes, informs, or measures. Each type should state its canonical source and responsible steward. This discipline prevents visual similarity from turning unlike concepts into interchangeable circles.

Time and version matter. Ownership can change, a workflow can be superseded, and an objective can end. The graph should distinguish current, historical, proposed, and inferred relationships. A generated suggestion that two workflows should connect is not the same as an approved operating dependency. Proposed edges can support planning, but they need labels and review before entering the current operating map.

Attach evidence and authority to relationships

Every material relationship should be traceable to a record or accountable owner. An approval edge may point to a policy or decision-rights registry. A dependency edge may point to a workflow contract or technical configuration. An outcome edge may identify the metric definition and observation window. The map can summarize these relationships while providing a route to the source that establishes their meaning.

Authority should not be inferred from graph position. A role near the center of a visual layout is not necessarily more powerful, and a parent node does not automatically approve every descendant. Controls must resolve the specific action contract and current actor. The map can show who is responsible for review, but the authorized system still validates the requested transition.

Section 3

A hypothetical order-to-cash change

A proposed change to order-to-cash work illustrates how the map can reveal consequences before implementation without pretending to predict every result.

Finding the operating path

Imagine a company wants to shorten the time between an accepted proposal and service activation. The operating map starts at that objective and reveals linked workflows: proposal approval, package and entitlement review, customer agreement, billing setup, provisioning, support handoff, and financial reconciliation. It identifies the responsible product lines and roles, along with known systems and evidence sources. The map does not assume that these connections are automated.

The team selects the provisioning handoff and sees dependencies on customer identity, approved commercial terms, billing state, access policy, and support readiness. A model may summarize likely friction, but each relationship retains its source and status. One stale process document is marked historical rather than merged with the current workflow. Missing ownership becomes a backlog or governance question, not a generated assignment presented as settled.

Reviewing a proposed change

The team proposes moving one validation earlier. The map creates a planning overlay that highlights affected decisions and reviewers. Finance can examine billing implications, operations can examine queue behavior, security can examine access consequences, and customer teams can examine communication. Each reviewer sees a bounded decision packet rather than a claim that the graph has already calculated the correct company-wide answer.

After a small approved change, observed events can update the workflow state and outcome signal. The team compares handoff timing, exception rate, reviewer burden, and unresolved effects against the baseline. A shorter step does not automatically establish better order-to-cash performance or causation. The map preserves the change and evidence so the organization can decide whether to expand, revise, or restore the prior path.

Section 4

Architect a graph view over canonical sources

The operating map should resolve typed references from existing systems and read models rather than become a parallel system of record.

Build a governed graph projection

A graph projection can ingest approved identifiers and relationships from operating-model registries, workflow definitions, backlog records, product-line contracts, and outcome definitions. Each node and edge carries provenance, version, freshness, scope, and visibility. The projection supports traversal and visualization, while the canonical systems continue to own edits and enforcement. Writeback should route through their governed actions instead of mutating graph storage directly.

Not every source will share the same identifiers or update cadence. The architecture needs resolution rules, conflict handling, and explicit unknowns. A manual mapping may be appropriate during early adoption, provided its steward and review date are visible. Similar names should not be merged automatically. Entity resolution errors can connect unrelated customers, teams, or workflows and produce convincing but false operating narratives.

Render for purpose and scale

The first view should begin from a selected outcome, role, workflow, or issue and load only the relevant neighborhood. Search, filters, saved views, and path explanations help users navigate without rendering the entire company. Stable layouts and direct labels are important because users need to compare relationships over time. Three-dimensional presentation may support some spatial tasks, but it should not be added unless it improves comprehension and remains usable across devices.

Dense graphs need alternative representations. A dependency table, hierarchy, timeline, or evidence list may be clearer for particular questions and more accessible to assistive technologies. The map should preserve equivalent semantic information across views. Visual distance, color, and animation should not encode unverified importance. The interface must state the relationship in text and expose the record behind it.

Section 5

Evaluate map accuracy and decision usefulness

The operating map should be tested for correct relationships, understandable navigation, and better impact review, not for visual impressiveness.

Audit graph truth and coverage

Select representative workflows and ask their accountable owners to review every displayed node and edge. Check identifier resolution, direction, type, effective dates, source references, and visibility. Include a renamed team, superseded workflow, shared dependency, disputed owner, and intentionally restricted record. Record false connections, missing material relationships, and stale edges separately because each failure requires a different correction path.

Coverage should be framed against the map's declared purpose. A launch-impact map may be complete enough for its decision while omitting unrelated company operations. Useful measures can include verified-edge rate, time to correct a stale relationship, and percentage of decisions with an accountable owner. Those measures describe map maintenance and should not be converted into claims about general company performance without supporting evidence.

Test decisions and recognize limits

Give users tasks such as identifying the owner of an exception, tracing a dependency to evidence, or assessing which reviews a proposed change may require. Observe incorrect inferences as well as completion time. A user who follows a visually prominent path to the wrong authority reveals a more important issue than a slow zoom interaction. Test equivalent keyboard and non-graph paths so the operating model is not locked inside one visualization.

Maps can create an illusion of completeness and causality. A visible connection does not prove that one node caused an outcome, and an absent connection does not prove independence. The graph can lag reality, contain disputed records, or omit informal work. It should display confidence and provenance where appropriate, support correction, and make room for human investigation beyond the modeled structure.

Section 6

Use OmegaOS to connect product lines without erasing them

OmegaOS can frame the company-level operating map, while each product-line OS and control plane supplies bounded domain relationships under its own responsibility.

Map the current responsibility model

Hermes - CommerceOS can contribute commercial workflows, Aureus - FinanceOS financial relationships, Vortex - OperationsOS operating dependencies, Agora - GovernanceOS governance structures, Vita - HumanOptimizationOS human-centered operating context, and Mnemosyne - MemoryOS source and lineage references. Forge contributes delivery-control relationships, while Studio helps make the resulting map consistent and reviewable.

OmegaOS connects these into a broader operating context but does not make the graph a platform authority over every domain. Product-line owners remain responsible for their records and judgments. The public names describe responsibility, not guaranteed connector coverage, live data, availability, entitlement, or automatic action. The map should disclose unsupported areas rather than drawing a complete-looking substitute.

Start from one outcome path

Choose an outcome with a known owner and a recurring coordination problem. Define the minimum node and edge types, map current sources, identify stewards, and review the first graph with domain owners. Add a single planning overlay for a proposed change, then evaluate whether users find dependencies and authority more accurately than they do in the current process.

This implementation path keeps the company operating map interface proportionate. The organization can expand only after it can maintain provenance, correction, access, and usable navigation. The map succeeds when it helps people ask better operating questions and trace them to accountable evidence, while OmegaOS connects product lines without pretending that the visualization is the company itself.

Assign maintenance before adding another graph domain. Node stewards need a way to correct identity, edge owners need a review cadence, and users need a route to dispute a relationship without editing canonical records through the visualization. Track unresolved disputes and stale areas as part of map posture. A smaller graph with named stewardship is more credible than a broad company picture whose relationships no longer match operating reality.

Publish the map's purpose and coverage date beside the view. That small disclosure helps users distinguish a maintained decision model from a comprehensive inventory and gives stewards a concrete point at which to reassess missing or outdated relationships.

Share this page

Send this OmegaOS resource to someone working on the same problem.