OmegaOS
Proof and Outlook

Company Operating Graph Explained

Company Operating Graph Explained explains how founders, executives, and operators evaluating an AI company operating system can understand the autonomous agentic company OS category and choose a bounded starting point while preserving the OmegaOS evidence and authority boundary.

hermes-growthpillar:pillar-01-category-creationcluster:cluster:pillar-01-category-creation:05
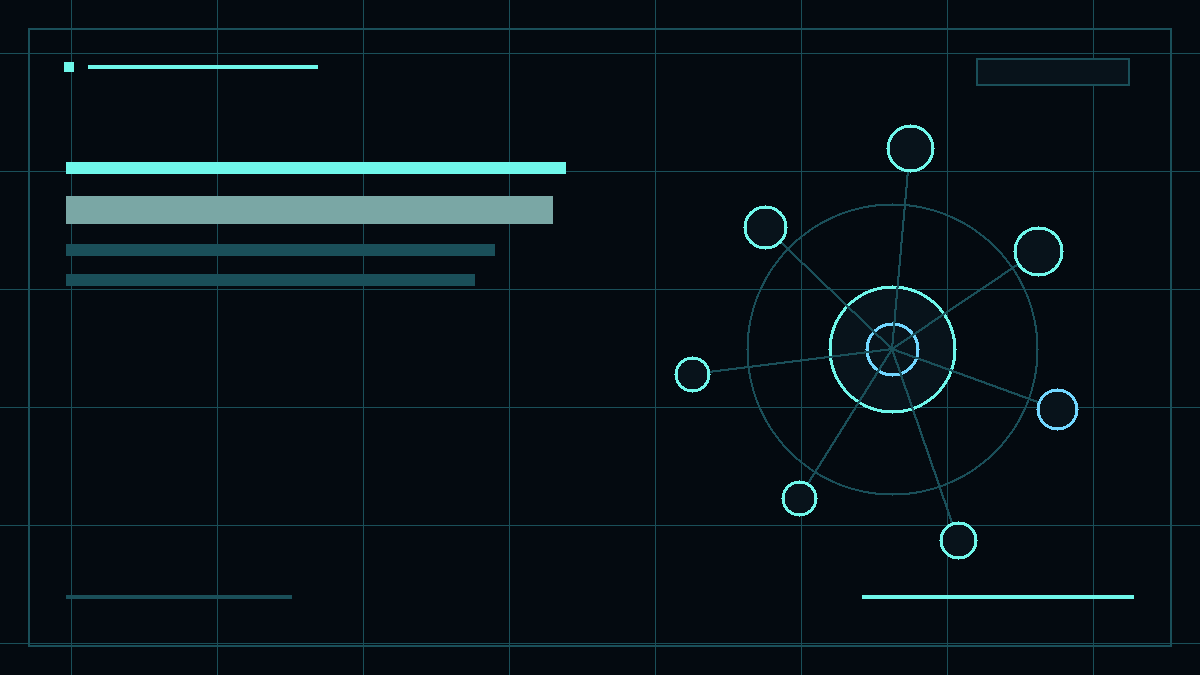
OmegaOS editorial illustration for Company Operating Graph Explained. Company Operating Graph Explained public OmegaOS visual showing the main buyer outcome.
OmegaOS editorial illustration for Company Operating Graph Explained. Company Operating Graph Explained public OmegaOS visual showing the main buyer outcome. Source: Omega Neural Technologies. Rights: Omega Neural Technologies original editorial asset.

Executive summary

Answer What is Company Operating Graph Explained? for founder, chief executive, chief operating officer and connect the answer to the Category Creation pillar, evidence, and next conversion path.

  • Category Creation buyer decision checklist
  • current product availability must be verified for the intended configuration
  • outcomes depend on scope, source quality, authority, and reviewed evidence
  • Proof and Outlook public guide
Section 1

A company operating graph is a map of accountable relationships

The phrase "company operating graph explained" describes a living model of how goals, people, teams, customers, systems, workflows, decisions, evidence, cost, and outcomes relate, so the company can reason about work without reducing operation to an org chart.

The graph represents company meaning, not just data links

A conventional org chart shows reporting lines. A process diagram shows a designed sequence. A system map shows technical dependencies. A company operating graph can connect all three while preserving why the relationship matters. It can show that a customer signal informs a product decision, that a team owns the workflow, that a system holds authoritative state, and that an observed outcome should return to a named objective.

The graph is useful because company questions are relational. Which current source supports this public claim? Which workflows depend on a policy that is changing? Who can approve a customer-impacting exception? Which release affects a support procedure? A list of documents or tasks may contain the answer, but it does not necessarily represent the path among them or the authority attached to each transition.

A graph edge should not be treated as truth merely because it exists. Relationships need source, type, direction, owner, date, and confidence where appropriate. A decision can supersede another decision. A person can own one workflow without receiving access to every related record. An inferred relationship can support investigation without authorizing action. The semantics around the edge make the graph operationally useful.

The model stays above systems of record

Customer, finance, identity, document, project, and product systems should continue to own their domain state. The operating graph can reference entities and events from those systems, but it should not silently replace their authority with a convenient duplicate. Write-back and synchronization need explicit contracts, permissions, and conflict handling. The graph provides orientation across sources while domain truth remains governed where it belongs.

This distinction also makes the graph resilient to tool changes. A company can replace a project application or model provider while preserving the durable relationship between an objective, owner, workflow, evidence, and outcome. Adapters still require maintenance, and identifiers can change, but the company operating model does not have to be reinvented around each application.

Some relationships should remain outside the graph or be represented only through protected references. Secrets, unnecessary personal information, privileged legal material, and sensitive customer data do not become safer because they are connected. The company should model only what the purpose requires and apply access, retention, and correction according to the underlying information and applicable obligations.

Section 2

Nodes, edges, state, and time create the operating language

A useful graph needs clear entity types, relationship meanings, workflow state, temporal history, and authority rules so people and agents interpret the same structure consistently.

Model durable entities and typed relationships

Common nodes may include objectives, functions, programs, teams, roles, customers, offers, systems, sources, workflows, decisions, actions, evidence, risks, costs, releases, and outcomes. The exact vocabulary should match the organization. Adding every noun creates noise, while omitting authority and evidence leaves the graph unable to support consequential work.

Edges should express a specific relationship such as owns, supports, depends on, authorizes, affects, supersedes, produced, measured, or blocked by. Direction matters. A source may support a claim, but a claim does not own the source. A workflow may affect a customer record, but that does not make the workflow authoritative for the customer. Typed edges reduce the chance that proximity is mistaken for permission.

Identifiers and provenance keep the model inspectable. A node should resolve to the current record or an authorized representation. A material edge should explain where the relationship came from and how it can be corrected. Generated graph suggestions may help discover connections, but a plausible inferred edge should remain labeled and should not trigger sensitive action until the appropriate owner accepts it.

Represent change instead of freezing the company

Companies evolve. A policy is revised, a customer changes stage, a release supersedes behavior, an owner changes, and a workflow is retired. The graph needs effective dates, versions, state transitions, or events that preserve what was true at the relevant time. Rewriting the present record without history can make an earlier decision impossible to understand.

Workflow state should distinguish preparation, judgment, authorization, execution, release, observation, and stoppage. These states can be connected to different roles and evidence. An agent may produce a proposed action node, while an authorized person creates the accepted decision edge. A release owner may later connect accepted work to an environment. The graph prevents one completed activity from collapsing the full operating path.

Time also limits inference. A relationship observed during one project or customer case may not remain valid elsewhere. The graph should support expiration, review cadence, and uncertainty. It should surface conflicting current paths rather than silently choose the newest-looking record. A human owner or domain system may need to resolve which state is authoritative for the intended decision.

Section 3

The graph becomes valuable inside real workflows

A company operating graph earns its place when it helps a workflow assemble relevant context, route authority, expose dependencies, and connect action to an observed result.

A commercial signal can retain source and ownership

Imagine a market source describing a new buyer concern. The graph can connect the source to an evidence record, a market hypothesis, the relevant audience, current messaging, a campaign decision, and the owner responsible for judgment. If the source coverage is partial, that limitation remains attached. The system can propose research or a message review without automatically publishing a claim.

If an approved campaign proceeds, the graph can connect the brief to content, channel activity, destination, consent posture, follow-up owner, opportunity events, and later revenue or learning records where those records exist. This does not prove that the campaign caused a commercial outcome. It provides the lineage needed to evaluate attribution assumptions and to see where the operating path broke.

The same structure helps correction. If a claim loses support, the company can identify connected assets and workflows that may require review. If a segment assumption is rejected, the decision can supersede the earlier hypothesis without deleting the history. People retain authority over claims, relationships, offers, and spending while the graph reduces the effort required to see affected work.

A delivery change can expose cross-functional consequences

Consider a product behavior change. The graph can connect the originating customer evidence, product decision, affected components, delivery cards, validation, release posture, documentation, support guidance, entitlement behavior, public language, and outcome measures. Teams can see that implementation is only one part of the company obligation and that each dependent update has its own owner.

Before release, the graph can reveal blocked dependencies such as missing security review, unresolved package truth, incomplete customer communication, or an untested recovery path. The existence of an edge does not perform the review, but it prevents the dependency from remaining invisible. Release authority remains separate from agent or developer completion and should be recorded by the appropriate owner.

After release, service cases, usage, performance, or customer feedback can connect to the change. Those signals may support continued observation, rollback, correction, or an adjacent improvement. The graph makes the evidence easier to assemble but does not establish causation automatically. A reviewer still interprets whether the relationship is strong enough for the next decision.

Section 4

Build and test the graph from one decision path

A company should build the graph around a bounded decision it needs to make repeatedly, then test semantic accuracy, permission, freshness, and usefulness before expanding coverage.

Start with a question, not a visualization project

Choose a question such as which current sources and owners support a customer-facing product statement, or which workflows depend on a policy that is changing. Identify the minimum nodes and edges required to answer it. Connect current records through stable identifiers where possible and document which system or person owns each type of truth.

Define graph contracts before adding inferred relationships. State the allowed node and edge types, required provenance, temporal behavior, permission rules, and correction path. Decide how unresolved conflicts appear. A schema that rejects an ambiguous edge can be more useful than a visually complete graph whose relationships have no reliable meaning.

Provide views tailored to decisions. A security reviewer may need identity, resource, and action edges. A product owner may need customer evidence, decision, delivery, and outcome. A finance owner may need workflow, usage, supplier cost, budget, and value relationships. Showing every connection to every user creates cognitive load and can expose information beyond the purpose.

Evaluate graph quality and failure modes

Test whether an authorized person can answer the target question and verify the supporting source. Introduce a superseded document, duplicate entity, conflicting owner, missing identifier, and denied role. The graph should expose uncertainty or refuse the view rather than invent a clean path. Retrieval speed is useful, but a fast wrong relationship weakens company operation.

Track completeness and correctness at the decision boundary. Useful measures may include unresolved entity matches, stale relationships, source coverage, correction time, denied-access behavior, reviewer effort, and whether the graph helped the workflow reach a clearer decision. More nodes and edges are not a value measure. Growth can indicate duplication or uncontrolled ingestion rather than better understanding.

Plan for deletion, retention, and dependency failure. A source system may be unavailable, a connector may stop updating, or a record may need restriction. The graph should show stale or broken relationships and avoid treating cached state as current authority. Legal, privacy, and security requirements can vary, so qualified review may be needed for sensitive graph content and retention.

Section 5

OmegaOS uses the graph as operating context, not automatic authority

OmegaOS is intended to use a company operating graph to connect company structure, workflows, evidence, product-line context, and learning while preserving human and system-of-record authority.

Who should use the graph approach

Founders and operators should consider the approach when they repeatedly reconstruct how a signal became work, who owns a dependency, or which evidence supports the current posture. Technical teams can use it to connect runtime activity to business meaning. Reviewers can use it to navigate source, authority, and release relationships. The value depends on a real decision need, not a desire for a complex visual.

Within OmegaOS, the graph can help assemble a bounded, source-aware context for a workflow, connect delivery work to responsible roles and evidence, and allow product-line systems to contribute governed domain context. Mnemosyne - MemoryOS can preserve source-backed continuity. These are intended architectural relationships, and the current implementation and access posture must be verified for the specific use.

A company audit can define the first graph question, source owners, sensitive boundaries, and success measure before broad ingestion. The initial graph may contain only one function and a small number of entities. Expansion should follow demonstrated usefulness and reliable maintenance, not the assumption that complete company representation is necessary from the start.

The evidence boundary remains essential

A graph cannot guarantee that every source is correct, every edge is current, every permission is enforced, or every inferred relationship is causal. It can make evidence and uncertainty easier to inspect when implemented carefully. Sensitive decisions still require authorized people, and technical controls still require validation in the actual environment.

The graph should not become a hidden scoring system for employees, customers, or business decisions without a defined purpose, evidence, review, and appropriate rights. Nor should its visual confidence be used as a public claim about integration completeness, security, or autonomous capability. Representation is not proof that the connected system can or should execute an action.

The strongest company operating graph explained conclusion is that relationships are part of company truth. OmegaOS is designed to preserve those relationships across intent, work, evidence, and learning. The company remains responsible for deciding which relationships are authoritative, which are uncertain, and which consequences require human judgment.

Share this page

Send this OmegaOS resource to someone working on the same problem.